by Christina | Dec 3, 2025 | 2025, Blog
Now that the dust has settled, the branding agency fired and the old brand restored, it’s a good time to look at what really happened with the rebranding of Cracker Barrel – something the mainstream media largely overlooked.
Let’s start with the firing of the agency behind the rebrand. Prophet – founded by Scott Galloway and Ian Chaplen with David Aaker as vice chairman – is a powerhouse branding firm known for rigorous research and disciplined strategy. This isn’t a group of amateurs crowdsourcing a logo.
Prophet does its homework, has A-list clients and has successfully delivered hundreds of rebranding and branding projects. What went wrong?
How bot activity fueled the rebrand backlash
The most interesting part of this story never made headlines – likely overshadowed by the president’s comments that turned the rebrand into a politicized moment.
What was largely missing from the uproar was the real source of the rapid outrage: bots. According to the Wall Street Journal, bots posing as real users drove a disproportionate share of the social chatter that media outlets picked up. PeakMetrics – which works with the U.S. Air Force to identify foreign misinformation – found that the backlash originated from high-follower human accounts but was quickly amplified by bots.
By August 20, the day after the launch, X saw about 400 Cracker Barrel posts every minute. Molly Dwyer, director of insights at PeakMetrics, said 70% of accounts posting used duplicate messages, with some repeating the same text dozens of times – a clear sign of bot activity. Nearly 45% of Cracker Barrel posts on X during that 24-hour surge were estimated to be bot-generated. PeakMetrics also reported that almost half of all posts calling for a boycott came from bots.
Why the spike? Foreign entities often try to stoke political tension by tapping into what Dwyer describes as a ready-made audience primed for negative engagement. In Cracker Barrel’s case, its rebrand landed squarely in the politicized crosshairs of social media – and bots did the rest.
What this means for B2B marketers
Consumer brands have greater visibility and appeal to a broader set of buyers than most B2B brands, so it’s easy to assume the business environment carries less risk.
But that isn’t necessarily true. Years ago, Google and CEB (now part of Gartner) researched the role of emotion in B2B purchasing decisions. One of the key findings was that buyers feel a stronger emotional connection to B2B brands than to consumer brands.
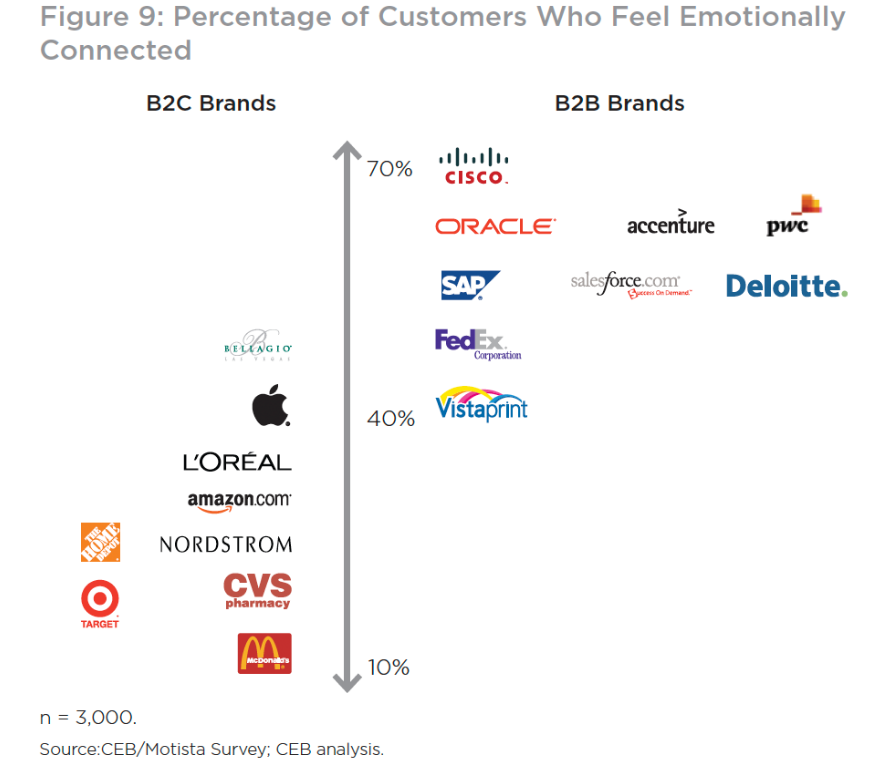
For many people, that’s surprising – but the reason is simple. It comes down to personal risk. If you buy the wrong L’Oréal lip gloss, it may be annoying, but you won’t lose your job over it. Choose the wrong enterprise software and you could damage your reputation, waste company money or even jeopardize your role. The stakes are higher, which drives a stronger emotional connection.
In our survey of over 400 B2B buyers across a dozen brands, we asked which brand attributes mattered most in their final purchasing decisions. Trustworthiness ranked number one, with reliability close behind.
What the Cracker Barrel backlash reveals about brand vulnerability
The Cracker Barrel episode is a stark reminder that even the most thoughtful, research-driven branding efforts can be derailed when they collide with today’s volatile digital ecosystem. The real story wasn’t a misstep by a seasoned agency or a logo that missed the mark – it was how bot-driven outrage can hijack a narrative and turn a routine brand refresh into a cultural flashpoint overnight.
For B2B marketers, the lesson isn’t to fear rebranding but to respect the emotional stakes involved. Buyers are more invested, more risk-averse and more attuned to signals of trust and reliability than we often assume. And while B2B brands may not receive the same amount of public attention as consumer giants, they operate in a space where reputational missteps carry significant professional consequences.
As lines blur between genuine sentiment, manufactured outrage and political polarization, marketers must approach rebrands with both courage and caution. Rebranding will always involve risk – but in a world where algorithms and bad actors can amplify negativity at scale, clarity, authenticity and stakeholder alignment have never mattered more.
by Christina | Jun 10, 2025 | 2025, Tech Trends
For the past month we have tested the performance of short form videos versus traditional blogs posted on LinkedIn.
Why do it?
Two decades ago, I started blogging. Back then, keeping a post under 2,000 words felt like a constraint. (I was a management consultant — so yes, I used a lot of words.)
A couple of years later I began writing for Forbes which trimmed my posts to 1,200 words. Then, while writing for The Drum,down even further to 800. As attention spans shrank, so did my word count.
Fast forward to today: content is everywhere, AI tools are flooding our feeds, and the pressure to stand out is greater than ever. So I find myself asking: Should I still write, or do I shift to short-form video?
The Experiment
To measure the effectiveness of each, we created three tiers of key metrics. Tier one being the most important, tier three being the least.
● Tier 1 – form fills on our website or DMs on Linkedin
● Tier 2 – profile views or website visits, views/read time of the content, new followers
● Tier 3 – reach, engagement (impressions, engagement, shares)
To track performance, we used Linkedin Analytics (post performance), Hubspot (form fills), GA4 (web performance), Warmly (web visits), and Looker Studio (blog performance). The time period included all posts and performance for the last 90 days (March 1 to May 30th) allowing us to have enough data to measure the performance before and after.
The top 8 viewed posts of the last 90 days were evenly distributed between video and blog content posted in the last 30 days as part of our test. The first video was released was the top viewed post, with the remaining three videos making up the 3rd, 7th and 8th most popular.
Correspondingly, blogs ranked 2nd, 4th, 5th and 6th, were almost of perfect distribution to compare, with both having a median between 4 to 5.
Overall performance for the last 90 days on LinkedIn, compared to the previous period, experienced a 20% lift in content performance (impressions) and a 42% increase in engagement. Even more striking is the 28 days compared to the previous period, which produced a 408% increase in impressions, and a 290% increase in engagement.
Given the Tier 3 performance, it might be logical to believe that increases will be seen in the other tiers.
The Results
Before I jump in, it’s important to recognize how LinkedIn counts impressions and views of videos.
An “impression” is registered every time your post appears in someone’s feed. It reflects overall visibility, not necessarily engagement, or that it has been seen/read. Think of it as a billboard along a road. The cars pass by but may or may not glance at it.
LinkedIn’s algorithm, based on the content and responses to it, then decides to distribute more broadly…or not.
A video view is counted when someone watches for at least 2 continuous seconds (down from 6 seconds in 2023), either via autoplay or a manual click. In this case, we are using autoplay.
To dig deeper into evaluating the performance we downloaded Richard Van der Blom’s Algorithm Insights Report 2025 for LinkedIn metrics and benchmarks. We tried to download LinkedIn’ Benchmarks for Brand Awareness, but the link is broken on the LinkedIn for Marketers page…I’ll let you draw your own conclusions.
Okay, now for the results. I’ll start with “members reached” defined as the number of distinct members and pages that saw the post. Caveat, this number is an estimate and does not include repeat displays. I’ll begin with Tier 3 metrics and work my way to Tier 1.
- Reach – no real difference between videos (60%) and blogs (57%).
- Consumption (read or watched) – video (70%) outperformed blogs (12%) but that number is misleading. The videos were set to autoplay and a view “counts”, even if it’s for only 2 seconds.
- View/read times – this becomes a more important metric given the prior statement and is closer to the truth. Videos still outperformed (35% to 20%), but this is an average. For video, it’s total viewed time divided by views, for blogs it’s average read time divided by total read time (eg. 1 min read time on a blog that is a 5 mins read).
- Reactions (likes, etc.) – video outperformed content significantly (almost 2 to 1), but that is skewered by video #1 which has nearly half of all the video reactions.
- Comments – viewers were more likely to comment on blogs, by 52% .
- Reposts – viewers were 5 times more likely to share a video.
- Profile views – blogs were twice as likely to generate a profile view. But, when compared to the previous period, my profile views over the last 28 days decreased.
- Audience growth – you might assume given the previous statement about the 90 day overall improvement in performance would net an increase in my audience, but unfortunately, that was not the case. There was no change. Additionally, most of the views, (almost 90%+) came from my first connections.
- Web visits and/or visits to the Linkedin Company page – recognized no change, and visits to our corporate page actually declined by 18% during the period.
- Tier 1 metrics – neither format produced a form fill or a DM.
Interestingly enough during this test period, a post on ABM written by Ruth Stevens, mentioned an article I had written years ago drove more traffic to our site in one day than anything else we did on LinkedIn the past 90 days..
Learnings
How you view these results really depends on how you view LinkedIn as a channel and your desired goals…a la the key metrics listed. I also came away with as many questions as I did answers.
For me, blogs have a slight advantage over short form videos (for now), purely from the ease of creating them. Additionally, based on the performance of the comments and profile views, I feel like viewers were more invested in the content.
Now for some caveats… I’m making this comment as a Gen X twenty-year blogger with a mature senior executive audience. This brings up an interesting challenge we faced, and soon I’ll be creating another post going into more detail.
Trying to reach a new audience, we tested upgrading my account to Premium and using paid ads on our corporate site, hoping to boost video views for the last two weeks. Neither produced the results we hoped for, and/or was promised by LinkedIn.
LinkedIn Premium claims it will “expand your network and increase visibility.” We saw no evidence of that being true, as I mentioned 90%+ of the reactions came from 1st connections. Paid ads dramatically increased impressions (a relatively meaningless Tier 3 metric) but performed poorly, producing a 0.13% CTR with no conversions.
This raises a question on the value of the 800 lb gorilla of B2B channels, LinkedIn. LinkedIn has changed its algorithms to bring you more content from the creators you interact with, which somewhat explains the concentration of my audience.
The key insight from this experiment, at least for me, is that LinkedIn’s algorithms are geared towards the content consumer and not the creator.
The change in their algorithm means you are more likely to see more content from one creator than a vast group of creators. For example, you are 60% more likely to see a post from someone that you have interacted with on your feed. LinkedIn, like other social media platforms, is changing what you see in real time as you interact with what’s on your feed.
As a result, as pointed out by the Algorithm Report, reach, engagement and follower growth have declined dramatically since last year.
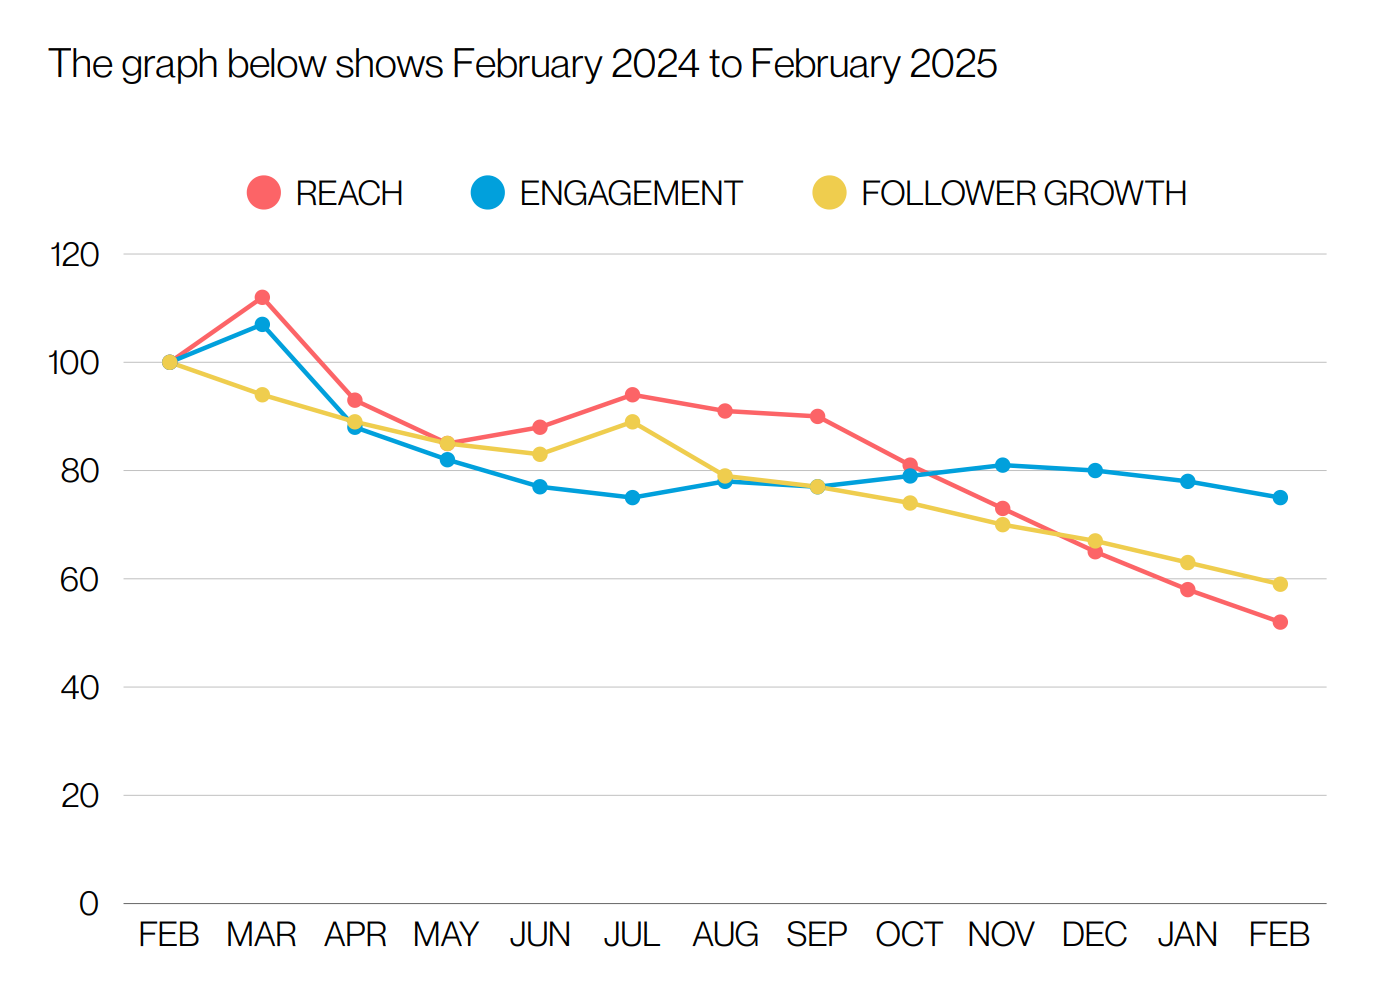
Source: Just Connecting™ and Richard van der Blom
The bottom line – the performance of short form videos may have been handicapped because I wasn’t able to reach an audience that prefers that content format.
LinkedIn lives on creator content and that content, according to the report, is quickly moving to video (an increase of 23% in 2024 over 2023). What the report doesn’t show, nor could we, is that it is any more effective than anything else.
If you’re searching for an ROI for the business impact of any type of content posted on LinkedIn, it may not be the format but rather the channel that is the problem.
Now let’s see if anyone reads this content…don’t make me do another video!
Special thanks to Ben Armstrong at 9Mile media for the creation of the videos and Naheed Somji, our social media guru for his support and advice.

by William Walsh | Dec 2, 2024 | 2024
By Scott Gillum
Estimated read time: 6 Minutes
You’re damned if you do, and damned if you don’t. This expression applies when trying to create and execute “personalized” campaigns.
As defined by Google’s Gemini, “personalized campaigns in B2B marketing means tailoring your marketing efforts including advertising, offers, and communications to specifically address the unique needs and interests of each individual B2B customer.”
If you go too deep into understanding prospects or customer’s needs and preferences, you can’t scale the campaign. If you go too shallow, then the message lacks relevance and connection to buyers. It’s a challenge we’ve faced working with clients for years.
We can delve deeply into understanding the preferences and motivations of buyers, creating truly personalized offers, only to be limited by our ability to do it at scale. That was, until we discovered the 65/75 rule.
At its core, the 65/75 rule exists because birds of a feather actually do flock together. People with similar personalities are drawn to work in certain industries, roles and organizations. Not only that, they also learn, shop and buy products and services in very similar ways.
After years of researching and profiling the personalities of tens of thousands of buyers, we have found that at least sixty-five percent of industries, companies and roles are comprised of two dominant personality types (using the DISC personality type indicator).
Learn more by viewing the Using AI Enabled Personality Based Marketing to Design ABM Programs webinar.
In some areas it was higher. For example, we found that fifty-three percent of the CEO’s of Fortune 500 companies have the same personality type. Sixty-five percent of the Chief Information and Security Officers in the financial services industry, also – have the same personality type.
In fact, the more advanced degrees (or professional certifications) a person has, the more likely it is to reflect their personality type. Said differently, your personality will often dictate the profession you pick or pursue. If you are not happy in your current position it may go deeper than just the job and/or manager. It may be in fact, at odds with your personality.
Discovering this insight led us to learn that personality types have preferences in how they learn and consume information. Influencers (the “I” in DISC) were fond of light, quick information like animated videos and infographics. Their motivations were often seeking new information to share with others…hence the term “Influencer.”
The same is true for how personality types consume certain content assets (case studies, white papers, video, etc.). Combining this insight with the insights on industries, companies and roles, we can now build out specific assets to attract the exact audiences we are targeting.
We are able to use the right “bait” based on the body of water and type of fish we want to catch.

Register for the Understanding Online and Offline Behaviors to Find Real Buyers and Influencers webinar.
Years ago, Pat Spenner, co-author of The Challenger Customer, and I tried to assess a way to target and attract “Mobilizers”, a type of buyers identified in the research for the book. These buyers played various roles within the buying group. There were two types that were of particular interest and value to sales and marketers. These individuals were more likely to either be motivated to start or lead a buying journey.
We knew their personality attributes but couldn’t figure out how to target and attract them. In a sense, we knew the fish we wanted to catch, but not the best lure to catch them. At the time, we were missing the data and technology to solve the mystery – a mystery that has existed for years.
Now, because of predictive and generative AI, we have the answers. Those “high value” mobilizers can be identified by their personality traits. Understanding their personalities then leads us to finding them in certain industries, companies and roles.
Knowing who they are gives us insight into how to speak to them personally, and do it at scale. AI tools can be trained to create content in their preferred language. Engagement data matched with personality type then guides us to their preferred sales and marketing assets (case studies, videos, etc).
For the Conscientious (the “C” in DISC who are prone to be “skeptics”), we use data and research backed content in an analytical tone. To play that out, to catch the fish (CISOs) in the body of water (Fin Serv industry) we’ve identified the bait (research and data backed content). It’s not 100% certain they will “bite”, but they are more likely to engage.
This brings up another interesting insight into the behaviors of personalities. For the skeptics I just mentioned, credibility is everything. Their top four information sources are people to people channels (peers, analysts, etc.). So, even if they don’t bite, you’re not losing credibility with them by giving them information they may find to be overly promotional or lacking substance.
Finally, this leads us to where they will show up in the buying process. The 65/75 rule continues to apply based on the industry. In professional services for example, sixty-five to seventy-five percent of audiences, early in the buying process, will be made up of two distinct personality types (the DI of DISC). The middle and end of the journey is the same story. The personality types change with the skeptics showing up late, for example, but the rule is the same.
It is the final piece that completes my fishing analogy. We know where the fish are most likely to be in the vast ocean of opportunity. All this to say, teaching a marketer to fish (using personality based marketing described above) can not only “scale,” but can also keep the salesforce fed for the year.

by William Walsh | Oct 28, 2024 | 2024
Being a boutique agency, we don’t usually have the time or resources to do an award submission. In fact, this is the first and only time we’ve done it.
We’re honored to be awarded a gold Davey Award for our work on @Trextel’s website redesign! 🏆
With great clients and support from our talented team (Shane, Joan, Joanna and Naheed), we refreshed the brand and the user experience. Oh, and we also won an award for the new logo design.🥈
The Davey’s are awarded to small agencies and it’s the largest agency awards program. Carbon Design only submitted too entries and won for both submissions, we’ll have to do this more often!
See the work for yourself: https://trextel.com/
Read more on our site: https://carbondesign.com/project/trextel/

by William Walsh | Oct 24, 2024 | 2024
There is a screenshot on my desktop that serves as a reminder. Every few months I click on it to remind myself of an important lesson not learned soon enough.
It reads, “If you don’t make time for your wellness, you will be forced to make time for your illness.” Twenty years ago, I was a management consultant working long days with weekly travel. During one stretch, I was away from the office (and from family) from Monday through Thursday, onsite at client headquarters in New Jersey.
When I wasn’t traveling, my commute to work was often an hour or more as a result of living in one of the most congested cities in the country. The stress and hours of the job led to terrible eating and sleeping habits. I’d eat whenever and wherever I could, at whatever hour I manage to take a break.
And because of the schedule, finding time to exercise was close to impossible. If I did have the time, I’d be too exhausted to do anything. As a result of this lifestyle, I gained twenty five pounds, but was in total denial that this was happening. My wife noticed, though, and encouraged me to get a physical. When the doctor told me I needed to drop some weight I was actually offended by the comment.
This period of time in my life is now affectionately referred to by my kids as my “Fat Dad” phase. Being many years removed from it, I can only now see the truth. It wasn’t until my pending fortieth birthday, when a friend suggested we’d celebrate the occasion by running a triathlon, I started to seriously consider the state of my health.
I am sharing this because I know I’m not alone. By your early thirties, you’re often married with young children and in the period of your career where you may have settled into a job or profession. You’re grinding away and focused on trying to make a name for yourself. This new found status of “family provider” often becomes the primary focus and you, in a sense, sacrifice your own wellbeing for that of the family.
So why am I talking about this now, twenty years later? Because yesterday I did something that I would not have done back then in those stress consuming days.
As the expression goes; “As you get older you don’t need to set an alarm because your troubles will wake you”. I awoke thinking of a big presentation only a few hours away. After having my coffee, I left the kitchen, but instead of heading directly up to my office, I went for a run.
During the forty-five minute route around our neighborhood, I organized the presentation in my head and thought of two new slides I needed to create. After showering, I put the finishing touches on the presentation in ten minutes.
Twenty years ago, I would have commuted the hour to my office, stared at my computer for a couple of hours, and tried to figure out how to complete the presentation. As I ran, I thought about how my approach of completing tasks like this has evolved in terms of efficiency, and the impact on my health.
The silver lining of Covid was the ability for employees to work remotely. According to The Association of Psychological Science, that period of time offered a whole host of mental and physical health benefits. Among them, reduced stress levels from not having to commute to the office, along with avoiding toxic co-employees in the workplace.
Another benefit was the ability to have greater control over your time. We can’t avoid Zoom calls, but we can take breaks throughout the day when needed. A chance to walk around the block, get in a workout at the gym and perhaps eat a healthier meal. According to the National Bureau of Economic Research, remote workers on average saved 72 minutes daily, which was then redistributed towards work related tasks (40%), leisure time (34%), and childcare (11%).
Now with the return to the office, old habits may also return. Cortisone levels may increase from the stress of the commute and the office environment. Office routines will return, grabbing a bite to eat if/when there is time, from whatever location is convenient. Feeling like there isn’t enough time to accomplish everything we need, may reignite the anxiety of years gone by.
But just because you may be returning to an unhealthy environment doesn’t mean you have to become a victim. Much has changed since COVID, companies have become much more aware of mental wellness and impact of long hours on the well being of their employees. The recent announcement by major investment banks to limit the hours of junior employees is the latest example.
Additionally, there is a slew of apps and wearable devices which can help to combat the routine and bad habits of the typical work day. All of this is great, but it still comes down to you. Acknowledge when you’re feeling overwhelmed.
Be conscientious of creating a balance between stress and stress relief. Take advantage of resources available to you, and don’t be too proud to admit to yourself (or others) that you might not be able to get it all done in a day.
One of the best pieces of advice I was given happened when I was in my late twenties. I was newly married, working full time, and going to grad school at night, totally stressed out. So I asked a colleague who was a single mom and managed close to 200 employees (another 200 kids as she would say) how she was able to do it and she said; “I do as much as I can…and then there’s tomorrow.”


